

Report: First destination after undergraduate degree
Our First Destination Report:
- We survey new graduates who complete undergraduate degrees and report data by academic year of graduation.
- We ask first destination career status after the undergraduate degree, whether:
- employed
- continuing education
- military service
- volunteering
- seeking employment
- seeking continuing education - We ask about career preparation and experience during college.
- The survey opens before commencement and remains open through six months after. Reports are published winter after the survey closes.
Select a year to view report menu for total university, colleges, and majors:
- full report on 2023-2024 graduates to be published late February 2025.
- 2022-2023 graduates
- 2021-2022 graduates
- 2020-2021 graduates
- 2019-2020 graduates
- 2018-2019 graduates
- 2017-2018 graduates
- 2016-2017 graduates
- 2015-2016 graduates
- 2014-2015 graduates
- 2013-2014 graduates
All report information is subject to correction and updating.
What if a major is not on the report menu?
Each graduate is counted once, for primary major. A major is on the menu if at least one degree was conferred for the major as primary. In each report, total graduates and total respondents are the first counts shown, so if the major had zero respondents, that is shown.
Report timing:
For graduates of an academic year, reports are compiled after the survey closes. The survey remains continuously open through six months after May commencement. This enables us to publish the report by March of the year following commencement.
You can also read:
About the survey. | Methodology. | FAQs.
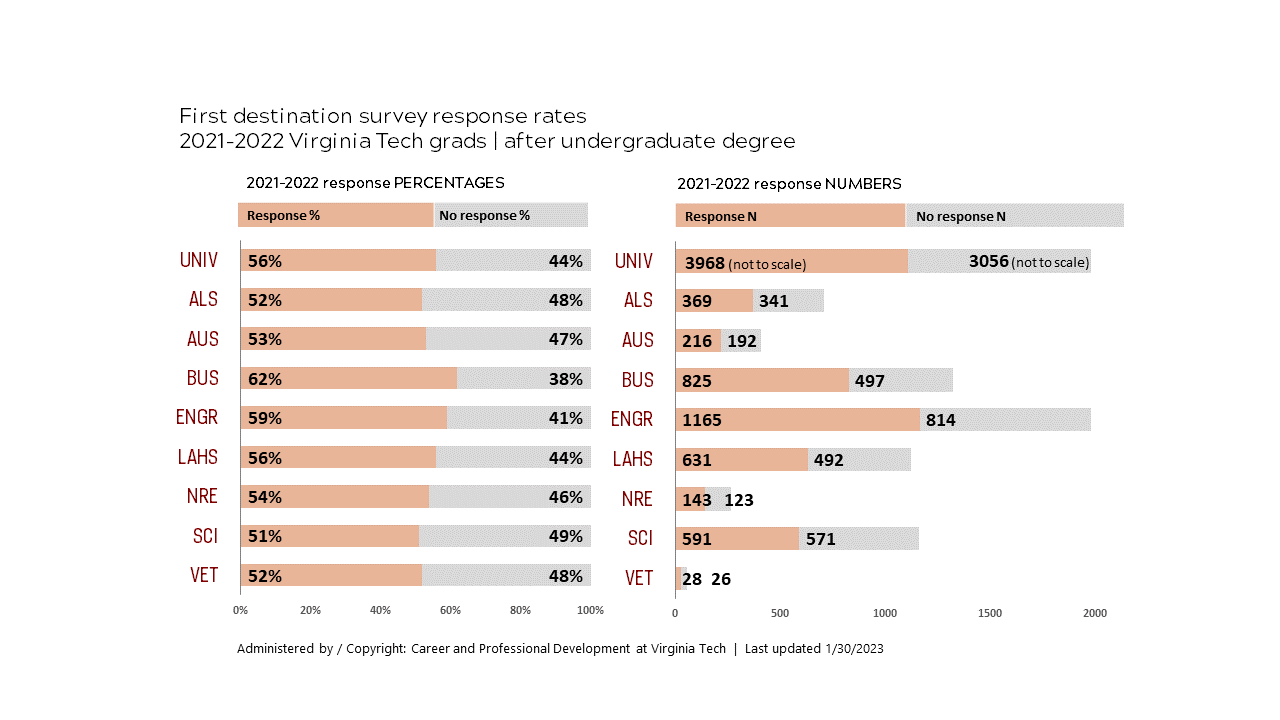
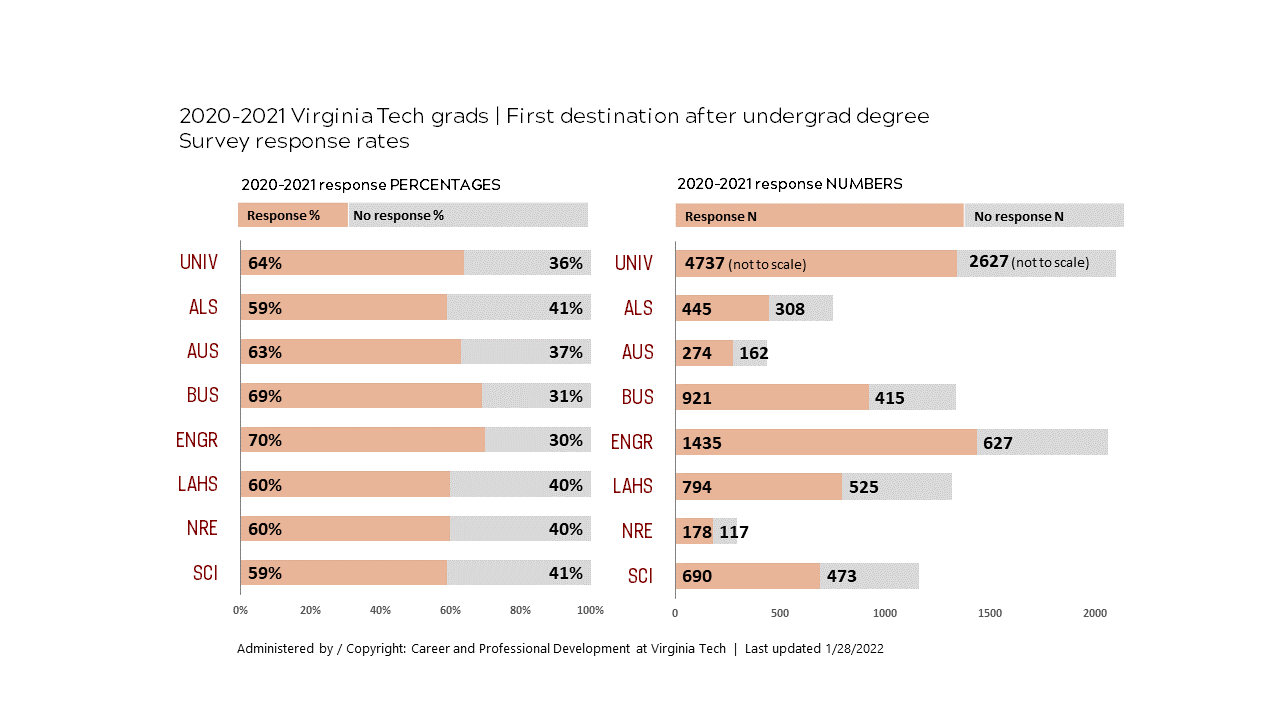
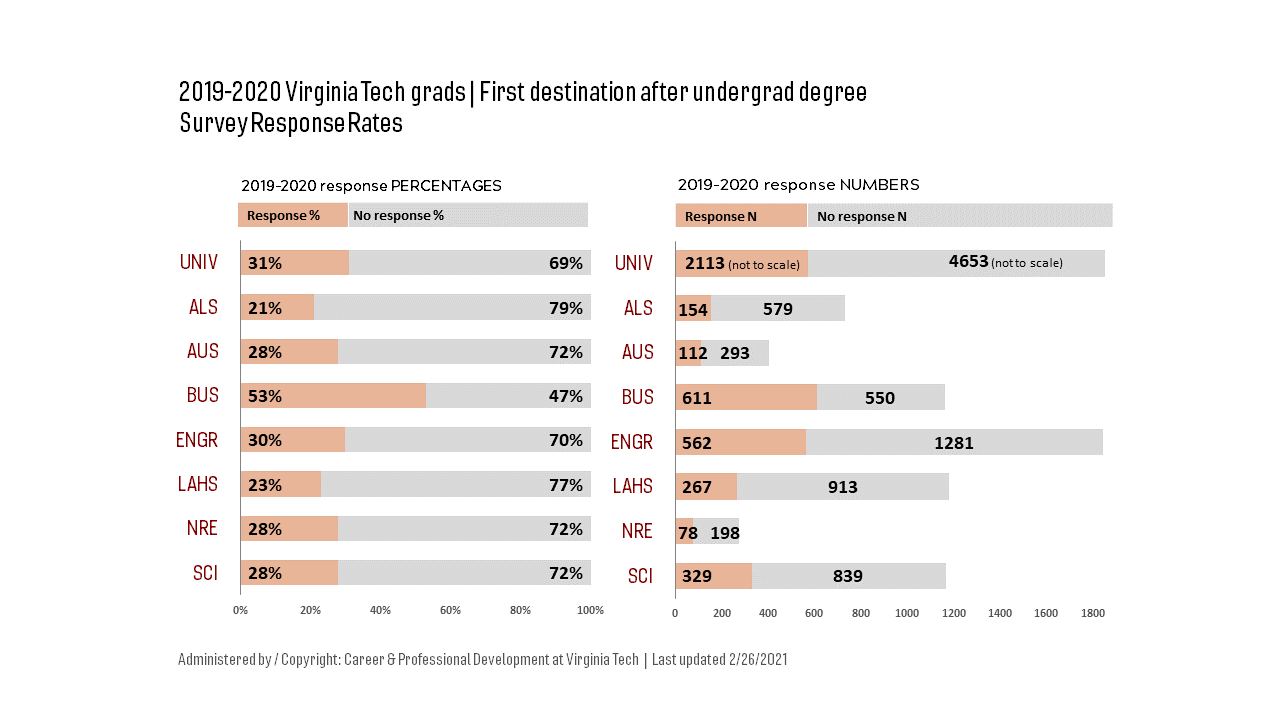
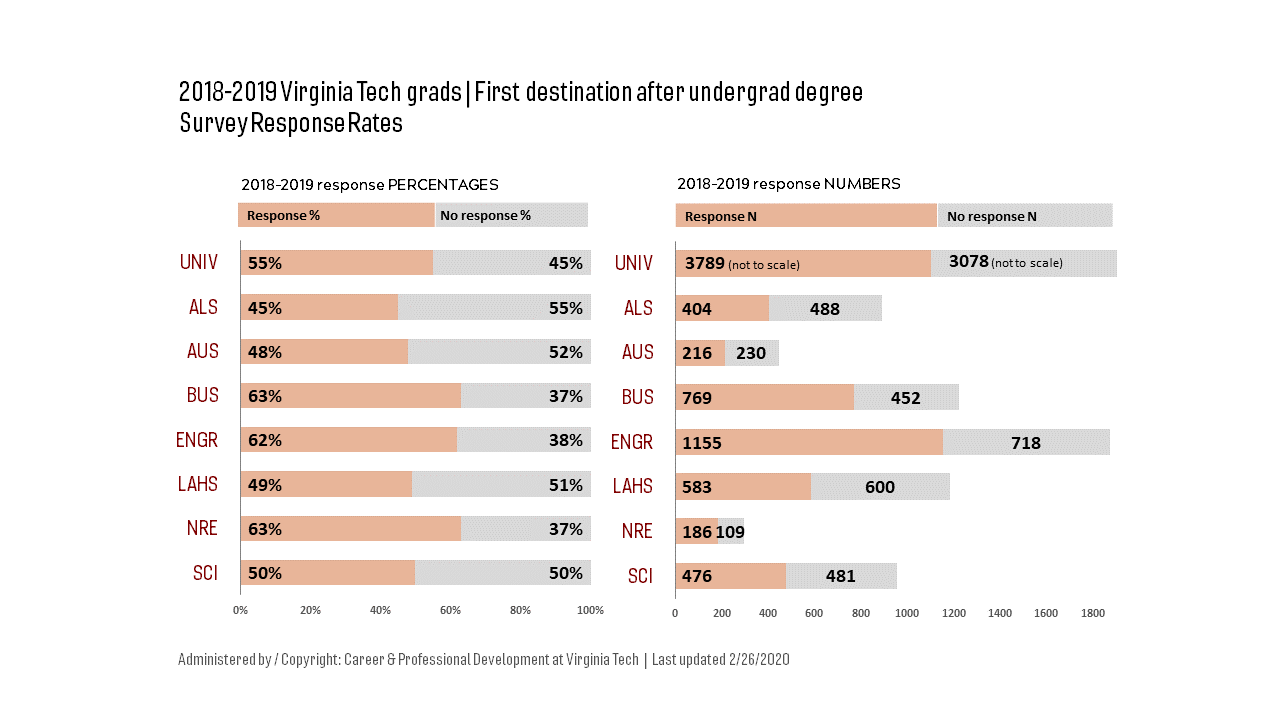
First destination survey response rates.
Total university and colleges.
Numbers and percentages of graduates who completed the survey about their first career status after the undergraduate degree.
| First destination survey response rates | Undergraduate degree recipients |
2018-2019 | 2019-2020 | 2020-2021 | 2021-2022 | 2022-2023 | 2023-2024 |
|---|---|---|---|---|---|---|
| Total university | 55% N=3789 |
31% N=2113 |
64% N=4737 |
56% N=3968 |
64% N=5110 |
63% N=4682 |
| College of Agriculture & Life Sciences | 45% N=404 |
21% N=154 |
59% N=445 |
52% N=369 |
59% N=427 |
56% N=399 |
| College of Architecture, Arts, & Design (college name effective for 2022-2023 grads) |
48% N=216 |
28% N=112 |
63% N=274 |
53% N=216 |
66% N=223 |
55% N=180 |
| College of Business | 63% N=769 |
53% N=611 |
69% N=921 |
62% N=825 |
70% N=1070 |
73% N=1128 |
| College of Engineering | 62% N=1155 |
30% N=562 |
70% N=1435 |
59% N=1165 |
67% N=1671 |
65% N=1435 |
| College of Liberal Arts & Human Sciences | 49% N=583 |
23% N=267 |
60% N=794 |
56% N=631 |
60% N=743 |
57% N=627 |
| College of Natural Resources & Environment | 63% N=186 |
28% N=78 |
60% N=178 |
54% N=143 |
66% N=182 |
68% N=174 |
| College of Science | 50% N=476 |
28% N=329 |
59% N=690 |
51% N=591 |
58% N=738 |
59% N=681 |
| College of Veterinary Medicine | NA | NA | NA | 52% N=28 |
54% N=56 |
56% N=58 |
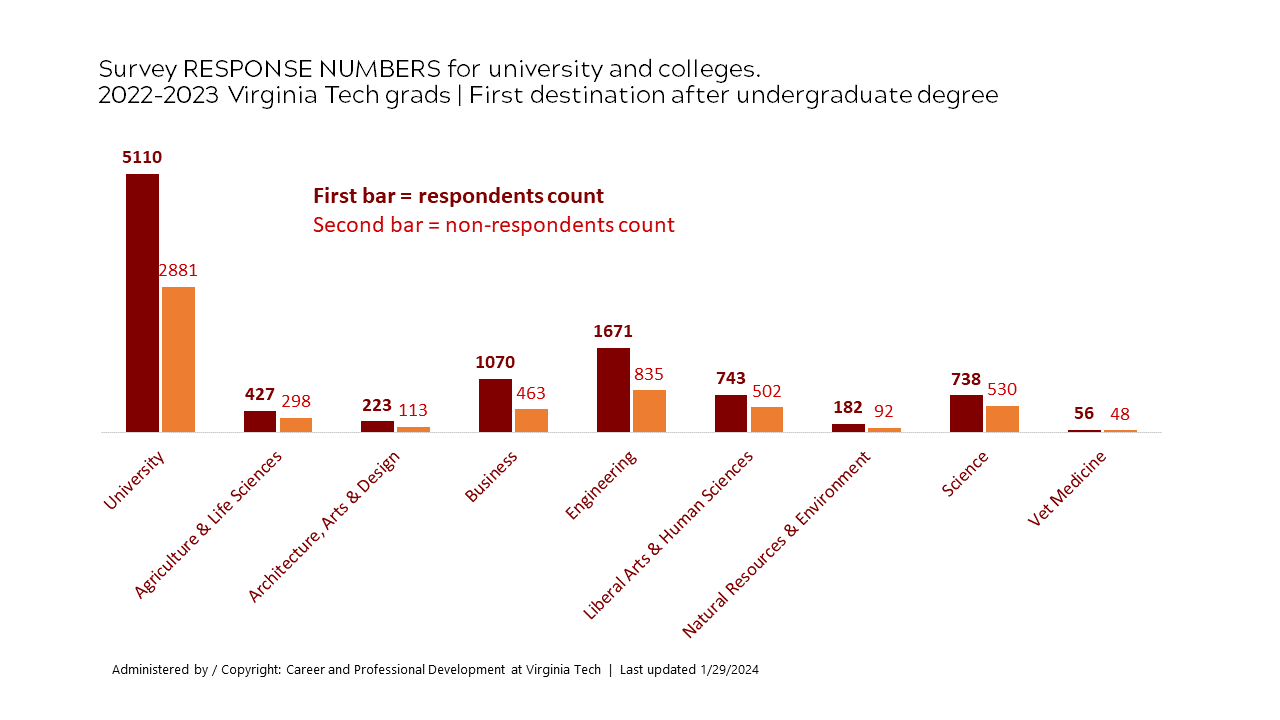
Survey response NUMBERS, university and colleges

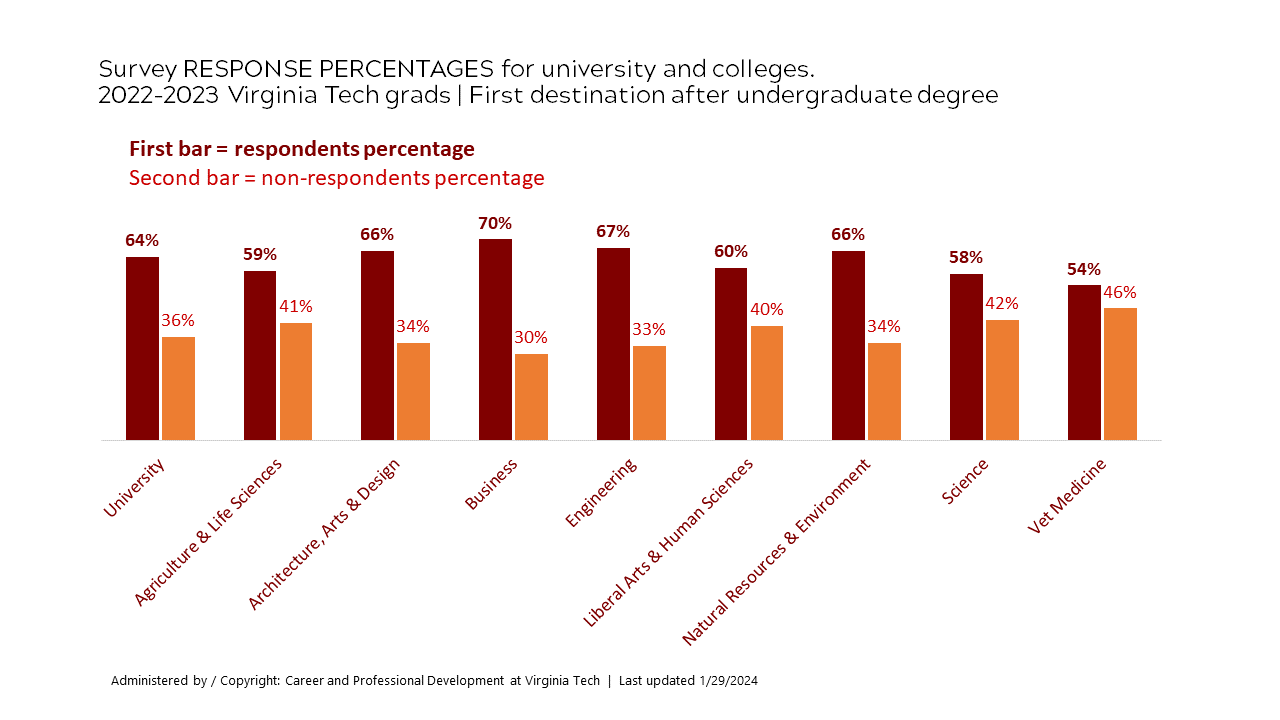
Survey response PERCENTAGES, university and colleges

About response percentages and numbers:
- For eleven years, total university response has ranged from 55-69%, with the exception of 2019-2020 due to COVID-19 impact on 2019-2020 survey timeline and response rate.
- College population numbers vary greatly. University data are influenced by colleges with larger populations of respondents. For example, in 2023-2024 eight colleges conferred undergraduate degrees, but over half of total university respondents were from two colleges: College of Engineering (31%), and College of Business (24%).
- Major population numbers vary greatly. College data are influenced by majors with larger populations of respondents. For example, in 2023-2024 the College of Agriculture and Life Sciences conferred undergraduate degrees in 18 majors, but one major, human nutrition, foods, and exercise (HNFE), comprised 25% of the respondents for that college.
- In addition to our efforts to encourage new graduates to respond to the survey, advisors, faculty, and staff who work with graduating seniors help to encourage response. If you would like to encourage more of your graduating seniors to respond: The survey opens before commencement and stays open for six months after; you can send your new grads to the survey information throughout that time. The best time periods to get responses are April to May commencement (for May and summer term grads), and late November to December commencement (for December and winter term grads). You can mark your calendar to remind them, and direct them to the survey information that includes open and close dates based on grad term. Your efforts have value and may make the difference to graduating seniors who know you.
The report for each major and college are in the graduation year reports, above. In each report the first data are the total number of graduates for that academic year, and the response and non-response numbers and percentages. Majors are included in the report year if at least one degree was conferred (as first, a.k.a. primary, major), even if there were zero respondents.
First destination of respondents.
Total university. Undergraduate degree recipients.
- Table view | university | multi-year
- Graph view | university | multi-year
- Data for colleges and majors
| First destination of RESPONDENTS | Undergraduate degree recipients |
2018-2019 | 2019-2020 | 2020-2021 | 2021-2022 | 2022-2023 | 2023-2024 |
|---|---|---|---|---|---|---|
| Response rate | 55% N=3789 |
31% N=2113 |
64% N=4737 |
56% N=3968 |
64% N=5110 |
63% N=4682 |
| Employed | 60% N=2261 |
64% N=1352 |
50% N=2349 |
57% N=2276 |
56% N=2867 |
53% N=2469 |
| Continuing education | 17% N=633 |
16% N=343 |
19% N=919 |
18% N=714 |
20% N=1020 |
20% N=914 |
| Military | 3% N=99 |
2% N=45 |
3% N=147 |
2% N=99 |
3% N=130 |
3% N-124 |
| Volunteering | 1% N=33 |
1% N=16 |
1% N=25 |
0% N=14 |
0% N=13 |
0% N=15 |
| Seeking employment | 16% N=617 |
13% N=282 |
21% N=982 |
17% N=666 |
17% N=867 |
21% N=971 |
| Seeking continuing education | 3% N=127 |
3% N=64 |
6% N=293 |
5% N=189 |
4% N=188 |
4% N=168 |
| Not seeking | 1% N=19 |
1% N=11 |
0% N=22 |
0% N=10 |
0% N=25 |
0% N=21 |
Grads who reported seeking employment or continuing education could update their responses any time until the survey closed. They are reminded to do so, but there is not a way to require this.

The report for each major and college are in the graduation year reports, above. In each report the first data are the total number of graduates for that year, and the response and non-response numbers and percentages. Majors are included in the report year if at least one degree was conferred (as first, a.k.a. primary, major), even if there were zero respondents.
Note:
- Not shown are "volunteering" and "not seeking," which are zero percent for most colleges, and 1% in a few cases. Exact data for colleges and majors are shown in the graduation year reports, above.
- Percentages do not always sum to 100 due to rounding.
| First destination of respondents, 2023-2024 grads, percentages by college | Employed | Military | Continuing Education | Seeking employment | Seeking continuing education |
|---|---|---|---|---|---|
| College of Agriculture & Life Sciences | 39% | 2% | 35% | 17% | 7% |
| College of Architecture, Arts, & Design | 47% | 2% | 11% | 37% | 2% |
| College of Business | 76% | 1% | 9% | 12% | 1% |
| College of Engineering | 58% | 3% | 19% | 19% | 1% |
| College of Liberal Arts & Human Sciences | 36% | 4% | 23% | 30% | 5% |
| College of Natural Resources & Environment | 45% | 6% | 11% | 33% | 4% |
| College of Science | 34% | 2% | 29% | 24% | 10% |
| College of Veterinary Medicine | 16% | 0% | 36% | 38% | 10% |
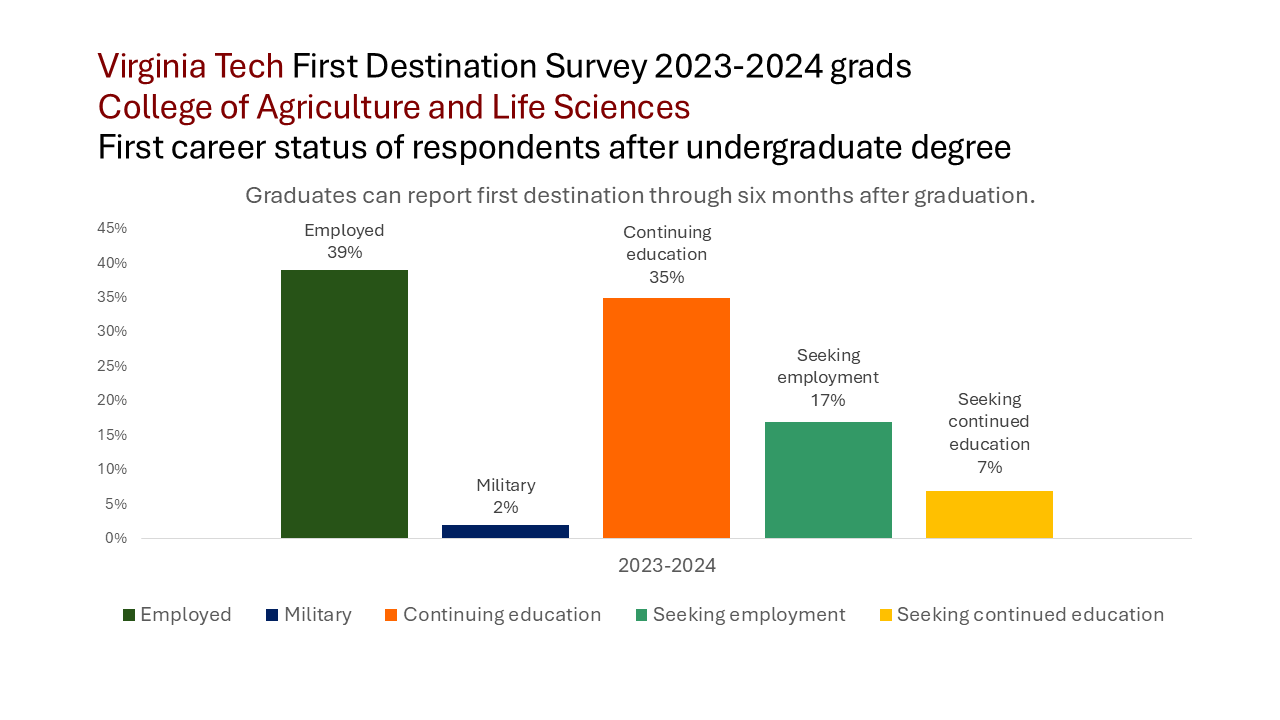


About first destination variance by colleges
- Colleges and majors have varied patterns in first destinations of respondents.
- For three colleges, Agriculture and Life Sciences, Liberal Arts and Human Sciences, and Science, typically a quarter to a third of respondents indicate continuing education as a first destination after the undergraduate degree.
- The College of Business often has the lowest percentage of respondents reporting continuing education, as compared to other colleges. However, a major within that college, accounting, typically has high levels of continuing education (31% of 2023-2024 respondents).
- Major and college data are in the graduation year reports, above.
Major and college data are in the graduation year reports, above.
About continuing education
- Respondents who stated they were admitted to continuing education as a first destination career status after the undergraduate degree were asked to provide the degree type, program of study, and institution to which they had accepted admission.
- Respondents who wished to continue education, but had not yet been admitted, should have indicated on the survey they were seeking continued education. Those respondents were reminded they could update their survey response, as long as the survey was open, if they were admitted or their career status otherwise changed.
Summary | university | six years:
Respondents of six graduation years, 2018-2019 through 2023-2024:
- Annually, 19-25% stated they either obtained or were seeking admission to continuing education as their first destination career status after the undergraduate degree.
- 16-20% said they were admitted to continuing education.
- 11-15% of respondents said they were admitted to a master's degree program.
- 5-6% were admitted for other degrees, or non-degree programs, or did not provide degree-level information.
- 3-6% said they were seeking admission to continuing education.
Total university, multi-year data.
First career status continuing education, and degree types, after undergrad degree.
| Responses about continuing education as a first career status after the undergraduate degree | 2018-2019 grads | 2019-2020 grads | 2020-2021 grads | 2021-2022 grads | 2022-2023 grads | 2023-2024 grads |
|---|---|---|---|---|---|---|
| N respondents admitted to continuing education | 633 | 343 | 919 | 714 | 1020 | 914 |
| % respondents admitted to continuing education | 17% | 16% | 19% | 18% | 20% | 20% |
| % respondents seeking admission to continuing education | 3% | 3% | 6% | 5% | 4% | 4% |
| % respondents admitted, degree type master's degree | 11% | 11% | 13% | 14% | 15% | 14% |
| % respondents admitted, degree type doctoral degree | 4% | 4% | 4% | 3% | 3% | 4% |
| % respondents admitted, other degree types, or non-degree, or did not provide degree type | 2% | 1% | 1% | 2% | 2% | 2% |

Degree type tables for continuing education respondents | by undergrad colleges and total university
- Degree type tables for respondents continuing education
Six graduation years, from 2018-2019 through 2023-2024.
List by undergraduate major: continuing education degrees, programs of study, and institutions.
Default list for each graduation year is for total university. On the list you can opt to view only a specific college or major.
Default sequence is alpha by undergraduate major of respondents. On the list you can sort by clicking on any heading.
Details on N and percentages continuing education are also in the report for each major and college in the graduation year reports, above.
List of employers, job titles, and locations, by undergraduate major
- Respondents who stated they secured employment, including military service, after the undergraduate degree were asked to state their job title, employer organization, and location.
- Default lists, below, are alpha by undergraduate major of respondents.
On each list you can opt to view one college or major.
Sort by clicking on any heading.
List of employers, job titles, and locations, by undergraduate major by graduation year:
Employers most cited by employed respondents
- View lists of most-cited employers by employed respondents.
You'll see:- Single year reports for eight graduation years, from 2014-2015 through 2023-2024.
- Number and percent of employed respondents who said they are working for the most-cited employers.
- A few stats from the most recent graduation year:
- The first-listed employer was reported by 53 grads who comprised 2.02% of employed respondents.
- Nine employers were each reported by more than 20 grads.
- Virginia Tech was reported as the employer by 23 grads, and was tied as 8th most-reported employer.
2023-2024 graduates reporting employment, including military service:
- 46% gave their work location state as Virginia.
- 6% reported North Carolina.
- 5% reported the District of Columbia and Maryland.
- Ranked list below where more than 10 graduates reported the location. All percentages rounded.
- For locations by undergraduate majors: 2023-2024 employers, job titles, locations list.
| Rank | N | % rounded | Location |
|---|---|---|---|
| NA | 2,593 | 100% | All (employed, including military) |
| NA | 140 | 5% | No location given |
| 1 | 1,204 | 46% | Virginia |
| 2 | 148 | 6% | North Carolina |
| 3 | 138 | 5% | District of Columbia |
| 4 | 116 | 5% | Maryland |
| 5 | 66 | 3% | New York |
| 6 | 49 | 2% | Florida |
| 7 | 47 | 2% | California |
| 7 | 47 | 2% | Texas |
| 9 | 36 | 1% | Georgia |
| 10 | 34 | 1% | Pennsylvania |
| 11 | 33 | 1% | New Jersey |
| 12 | 26 | 1% | South Carolina |
| 13 | 23 | 1% | Washington |
| 14 | 21 | 1% | Massachusetts |
| 14 | 21 | 1% | Tennessee |
| 16 | 19 | 1% | Missouri |
| 17 | 16 | 1% | Connecticut |
| 18 | 15 | 1% | Colorado |
| 18 | 15 | 1% | Illinois |
| 20 | 12 | <0.5% | Ohio |
About salary and bonus data
- Employed graduates (including military) were asked to report salary and bonus. Not all do so.
- Over six years the percentage of employed respondents who reported their salary amount declined from 83% in 2018-2019 to 52% in 2023-2024.
- We report median (mid-point value) and not mean (average) because the median is more reliable.
Averages are skewed by outliers.
Medians provide a more realistic picture.
Particularly with self-reported data, errors and inaccuracies occur, making averages more subject to being skewed. - Medians are shown when four or more individuals reported salary or bonus.
- 25th and 75th percentiles are shown when 12 or more individuals reported salary or bonus.
- Salary tables | data for university, each college, and each major | graduation years 2014-2015 through 2023-2024.
- Bonus tables | data for university, each college, and each major | graduation years 2014-2015 through 2023-2024.
- Salary and bonus data for each college and major are also within the graduation year reports, above.
Total university. Six years.
Salary and bonus data highlights.
| Graduation year | 2018-2019 | 2019-2020 | 2020-2021 | 2021-2022 | 2022-2023 | 2023-2024 |
|---|---|---|---|---|---|---|
| % response | 55% | 31% | 64% | 56% | 64% | 63% |
| N response | 3789 | 2113 | 4737 | 3968 | 5110 | 4682 |
| % working | 60% | 64% | 50% | 57% | 56% | 53% |
| N working | 2261 | 1352 | 2349 | 2276 | 2867 | 2469 |
| % military | 3% | 2% | 3% | 2% | 3% | 3% |
| N military | 99 | 45 | 147 | 99 | 130 | 124 |
| % of employed who did NOT report salary | 17% | 24% | 29% | 30% | 34% | 48% |
| % of employed who DID report salary | 83% | 76% | 71% | 70% | 66% | 52% |
| N who reported salary | 1968 | 1064 | 1768 | 1667 | 1976 | 1359 |
| Salary median | $61,800 | $64,000 | $63,000 | $66,560 | $70,000 | $70,000 |
| % of employed who received a bonus | 31% | 30% | 23% | 27% | 26% | 20% |
| N who received a bonus | 741 | 418 | 564 | 640 | 784 | 518 |
| Bonus median | $5,000 | $5,000 | $5,000 | $5,000 | $5,000 | $5,000 |
Salary and bonus data are also contained within the report for each major and college in the graduation year reports, above.
Employed respondents were asked:
Regarding the job you accepted: Which best describes the way you first made contact with this employer?
Select one response.
Please note this question is not asking about all the job search methods used.
- 10-13% had first contact through experience working for their employer prior to graduation.
- 14-17% met their employer through contacts and networking.
- 9-13% made first contact by going directly to the employer's website.
| First contact with employer whose job grad accepted | 2018-2019 | 2019-2020 | 2020-2021 | 2021-2022 | 2022-2023 | 2023-2024 |
|---|---|---|---|---|---|---|
| Worked / volunteered with employer in the past | 10% | 10% | 12% | 11% | 13% | 13% |
| Knew or met employer through someone I know / networking | 14% | 14% | 16% | 17% | 17% | 15% |
| Career fair | 26% | 26% | 22% | 19% | 2% | 3% |
| Handshake (job posting platform used by Virginia Tech career center for employers to post jobs for VT students) | 6% | 6% | 7% | 6% | 6% | 4% |
| Employer interviewed in Smith Career Center (On-Campus Interviewing Program) | 2% | 3% | 1% | 1% | 1% | 1% |
| Went directly to employer's website | 9% | 9% | 10% | 12% | 13% | 9% |
| Used a job-seeker website other than Handshake | 7% | 12% | 11% | 12% | 11% | 8% |
| Info posted or messaged from my academic department | 2% | 2% | 4% | 4% | 2% | 1% |
| Employer spoke at a presentation I attended | 1% | 2% | 2% | 1% | 1% | 1% |
| Did not answer | 21% | 15% | 14% | 18% | 19% | 29% |

Data for each major and college are in the graduation year reports, above.
Employed respondents were asked:
Do you consider your job to be related to your career goals?
Do you consider your job to be related to your college major?
Total university. Six years.
Job related to career goals and major.
Summary:
- 53-62% said their job was very related to their career goals.
- 51-61% said their job was very related to their major.
- Only 2-3% said their job was not related to their career goals.
- Only 4-6% said their job was not related to their major.
| Job related to career goals | 2018-2019 | 2019-2020 | 2020-2021 | 2021-2022 | 2022-2023 | 2023-2024 |
|---|---|---|---|---|---|---|
| Very | 60% | 60% | 62% | 62% | 58% | 53% |
| Somewhat | 18% | 24% | 23% | 21% | 23% | 16% |
| Not | 2% | 3% | 3% | 2% | 2% | 2% |
| Did not answer | 19% | 13% | 12% | 15% | 17% | 27% |
| Job related to college major | 2018-2019 | 2019-2020 | 2020-2021 | 2021-2022 | 2022-2023 | 2023-2024 |
|---|---|---|---|---|---|---|
| Very | 58% | 56% | 61% | 58% | 58% | 51% |
| Somewhat | 18% | 26% | 21% | 22% | 21% | 18% |
| Not | 5% | 5% | 6% | 5% | 5% | 4% |
| Did not answer | 19% | 13% | 12% | 15% | 17% | 27% |
Data for each major and college are in the graduation year reports, above.
Grads were asked:
Which best describes the extent to which you learned job search skills during college?
Six graduation years:
- 27-29% learned all the job search skills they needed.
- 42-50% learned some, but not all they needed.
- 8-10% learned nothing, or very little.
- 11-21% did not answer the question.
| Learned job search skills during college: | 2018-2019 | 2019-2020 | 2020-2021 | 2021-2022 | 2022-2023 | 2023-2024 |
|---|---|---|---|---|---|---|
| I learned most that I needed | 28% | 27% | 29% | 29% | 29% | 27% |
| I learned some, but not all that I needed | 46% | 42% | 50% | 47% | 46% | 43% |
| I learned nothing, or very little | 8% | 10% | 9% | 9% | 10% | 8% |
| Did not answer | 18% | 20% | 11% | 14% | 15% | 21% |
Grads were asked:
If you learned job search skills, where did you learn them? Check all that apply.
Six graduation years:
- 28-37% career center (Career and Professional Development) resources.
- 26-39% websites external to VT.
- 28-33% academic-credit course in major or college.
- 36-43% advisors, faculty, staff in major or college.
- 41-48% employers and mentors at jobs and internships.
- 47-56% parents, adult relatives and family friends.
- 37-47% peers.
- 16-27% did not identify any source of learning.
| SOURCES OF LEARNING JOB SEARCH SKILLS (check all that apply) | 2018-2019 | 2019-2020 | 2020-2021 | 2021-2022 | 2022-2023 | 2023-2024 |
|---|---|---|---|---|---|---|
| Career and Professional Development; advising, presentations, website, etc. | 34% | 34% | 37% | 35% | 34% | 28% |
| Career Planning Guide; online booklet created by CPD. | 13% | 12% | 9% | 7% | 5% | 4% |
| Other books, magazines, print materials. | 7% | 6% | 7% | 6% | 5% | 4% |
| Websites external to Virginia Tech. | 36% | 33% | 39% | 37% | 36% | 26% |
| Academic-credit course in my major or college. | 29% | 28% | 33% | 31% | 28% | 29% |
| Not-for-credit program in my major or college. | 4% | 5% | 5% | 5% | 3% | 4% |
| Advisors, staff, professors in my major or college. | 39% | 38% | 43% | 38% | 36% | 36% |
| Other VT advisors, staff, professors, NOT in my major or college. | 11% | 12% | 12% | 11% | 10% | 8% |
| Employers, mentors at jobs, internships. | 48% | 47% | 48% | 46% | 44% | 41% |
| Parents, adult relatives, family friends. | 52% | 47% | 56% | 53% | 51% | 47% |
| Peers. | 46% | 44% | 47% | 42% | 40% | 37% |
| Did not answer | 16% | 20% | 16% | 21% | 22% | 27% |
Grads were asked:
As you recall: During college, did you use any resources provided by the Virginia Tech career center? (could include advising, workshops, website, Handshake, employment interviews, etc.)
Six graduation years:
- 7-12% said yes, often.
- 45-50% said yes, not often.
- 13-18% said never.
- 8-14% were unsure or did not recall.
- 10-20% did not answer the question.
| Used career center during college: | 2018-2019 | 2019-2020 | 2020-2021 | 2021-2022 | 2022-2023 | 2023-2024 |
|---|---|---|---|---|---|---|
| Never | 16% | 13% | 18% | 16% | 16% | 16% |
| Don't recall or unsure | 11% | 8% | 12% | 12% | 13% | 14% |
| Yes, but not often | 48% | 46% | 50% | 48% | 48% | 45% |
| Yes, often | 8% | 12% | 10% | 9% | 8% | 7% |
| Did not answer | 16% | 20% | 10% | 15% | 14% | 18% |
Data for each major and college are in the graduation year reports, above.
Graduates were asked if they had any type of career-related experience during college, and details about the types.
Six graduation years:
- The majority, 68-76% said yes, they had career-related experience during college.
- Only 7-15% said no.
- 10-22% did not give a response to this question.
| Did you have any type of career-related experience during college? | 2018-2019 | 2019-2020 | 2020-2021 | 2021-2022 | 2022-2023 | 2023-2024 |
|---|---|---|---|---|---|---|
| Yes | 75% | 71% | 76% | 68% | 69% | 65% |
| No | 10% | 7% | 14% | 15% | 14% | 14% |
| Did not answer | 16% | 22% | 10% | 17% | 17% | 21% |
| Separate question; in REGRETS below: Grads who wished they had gotten more experience during college |
31% | 23% | 36% | 33% | 33% | 32% |
Types of experience from most to least reported over six graduation years:
- Paid internship: 47-58%
- Summer job: 25-45%
- Part-time job: 24-33%
- Volunteer work: 16-23%
- Undergraduate research: 19-21%
- Unpaid internship: 11-15%
- Field study: 6-10%
- Co-op: 4-5%
| What types of experience did you have? Check all that apply. | 2018-2019 | 2019-2020 | 2020-2021 | 2021-2022 | 2022-2023 | 2023-2024 |
|---|---|---|---|---|---|---|
| Volunteer work | 22% | 18% | 23% | 20% | 18% | 16% |
| Part-time job | 27% | 24% | 30% | 33% | 32% | 30% |
| Summer job | 29% | 25% | 29% | 45% | 44% | 41% |
| Unpaid internship | 14% | 11% | 14% | 15% | 15% | 13% |
| Paid internship | 56% | 58% | 53% | 47% | 49% | 47% |
| Co-op | 5% | 5% | 5% | 5% | 4% | 5% |
| Undergraduate research | 20% | 19% | 21% | 19% | 20% | 19% |
| Field study | 9% | 6% | 10% | 9% | 9% | 9% |
| Did not answer | 24% | 28% | 23% | 35% | 34% | 37% |
Graduates who had paid and unpaid internships were asked how many. Not all respondents who said they had an internship provided a count of how many.
| Number of PAID internships during college | 2018-2019 | 2019-2020 | 2020-2021 | 2021-2022 | 2022-2023 | 2023-2024 |
|---|---|---|---|---|---|---|
| One | 24% | 25% | 23% | 24% | 26% | 23% |
| Two | 18% | 20% | 15% | 14% | 16% | 16% |
| Three or more | 9% | 10% | 10% | 9% | 7% | 8% |
| Not applicable or did not answer | 48% | 45% | 53% | 53% | 51% | 54% |
| Number of UNPAID internships during college | 2018-2018 | 2019-2020 | 2020-2021 | 2021-2022 | 2022-2023 | 2023-2024 |
|---|---|---|---|---|---|---|
| One | 13% | 11% | 13% | 11% | 11% | 9% |
| Two | 3% | 3% | 3% | 3% | 3% | 3% |
| Three or more | 1% | 1% | 1% | 1% | 1% | 1% |
| Not applicable or did not answer | 83% | 86% | 83% | 85% | 84% | 87% |
Data for each major and college are in the graduation year reports, above.
IF undergraduates did not have an internship during college, what was the reason?
There was not a lone, significant barrier to internships for large percentages of undergraduate students.
- As shown above, most undergraduates had an internship or other experience during college.
- Internships are not the only form of career-related experience, but many people focus solely on internships when asking about student experience.
- Effective with 2021-2022 graduates, for those who stated they did not have an internship, we asked the reasons. Latest data, for 2023-2024 graduates, for total university and each college, is below.
Respondents could check all that apply. - The most-cited reason was applicable to only 8% of respondents for total university:
"I did not need an internship. I had other forms of experience relevant to my career goals and/or major." - For data by major, see the 2023-2024 report menu, choose a major, and see NO INTERNSHIPS, REASONS.
| REASON: (respondents could check all that apply) | UNIV | ALS | AAD | BUS | ENGR | LAHS | NRE | SCI | VET |
| I did not need an internship. I had other forms of experience relevant to my career goals and/or major. | 8% | 18% | 3% | 3% | 4% | 11% | 7% | 15% | 9% |
| I did not know all the possible sources to find an internship. | 6% | 6% | 9% | 4% | 4% | 9% | 5% | 12% | 12% |
| I did not have all the job search skills I needed to secure an internship. | 7% | 6% | 8% | 5% | 6% | 7% | 5% | 11% | 9% |
| I did not have all the qualifications employers required. | 6% | 5% | 8% | 4% | 6% | 8% | 4% | 10% | 7% |
| Unpaid internships are the norm in my field, and I could not afford to work without pay. | 4% | 9% | 3% | 1% | 1% | 8% | 6% | 6% | 7% |
| I could not find an internship in the geographic location I wanted. | 5% | 7% | 9% | 4% | 4% | 7% | 7% | 7% | 5% |
| I could not find an internship with timing that worked for my schedule. | 7% | 9% | 9% | 4% | 5% | 8% | 9% | 10% | 3% |
| I was offered an internship, but it was cancelled by the employer (due to economic issues, or other causes) |
1% | 1% | 1% | 0% | 1% | 0% | 0% | 1% | 0% |
| I was offered an in-person internship at a location to which I could not relocate due to costs. | 1% | 1% | 2% | 1% | 1% | 1% | 0% | 0% | 0% |
| Did not answer OR question not applicable to these respondents. | 75% | 63% | 76% | 84% | 83% | 64% | 74% | 59% | 72% |
Total university. Four years.
Regrets about career preparation during college.
Graduates were asked:
If you could start over in college, is there anything you would do differently related to career planning?
Over four years:
- 28-40% said no, they mostly did what they needed to achieve their goals.
- 35-52% said yes, they would do something differently.
- 10-25% did not give a response to this question.
| If you could start over in college, is there anything you would do differently related to career planning? | 2018-2019 | 2019-2020 | 2020-2021 | 2021-2022 |
|---|---|---|---|---|
| No. Mostly I did what I needed to achieve my goals. | 38% | 28% | 38% | 40% |
| Yes, I would do something differently. | 46% | 35% | 52% | 47% |
| Did not answer. | 16% | 26% | 10% | 13% |
Graduates were asked:
If yes (I would have done something differently) check all that apply, to "I wish I had..."
| I wish I had: (check all that apply) (top regrets in bold) | 2018-2019 | 2019-2020 | 2020-2021 | 2021-2022 |
|---|---|---|---|---|
| Learned more, or earlier, about career options. | 33% | 26% | 37% | 35% |
| Learned more, or earlier, about graduate or professional school. | 18% | 14% | 21% | 18% |
| Asked advisors, staff, professors for advice, earlier, or more often. | 27% | 20% | 30% | 28% |
| Gotten more experience related to my major or career goals. | 31% | 23% | 36% | 33% |
| Started my job search earlier. | 23% | 17% | 28% | 26% |
| Used more or different job search resources. | 14% | 12% | 17% | 16% |
| (Did not check any regrets) | 48% | 62% | 43% | 45% |
Data for each major and college are in the graduation year reports, above.