

Advising data


Graphics above are highlights from multi-year data through 2023-2024.
Career and Professional Development advising data:
Single year:
2023-2024 advising data
Notes:
- Data year is May 16, 2023, to May 15, 2024.
- All information is subject to correction and updating. Percentages might not sum to 100 due to rounding.
- Data tables include enrollment data from university data commons to give context to advising counts.
Advising main topics by college and advisee type:
- View 2023-2024 CPD advising data (pdf) (updated 5/30/24) which includes tables of advising main topic for:
- All advisees (students, alumni, and others).
- Undergraduate students by college and total university.
- Graduate students by college and total university.
- Alumni by college and total university.
Undergraduate advising contacts main topic summary:
- 45% seeking experience during college.
- 17% seeking post-graduation employment.
- 16% Health Professions Advising (HPA).
- 15% career-major exploration.
- 4% planning for continuing education other than health professions.
- 3% not indicated by advisor.
2022-2023 advising data
Notes:
- Data year is May 16, 2022, to May 15, 2023.
- All information is subject to correction and updating. Percentages might not sum to 100 due to rounding.
- Data tables include enrollment data from university data commons to give context to advising counts.
Advising main topics by college and advisee type:
- View 2022-2023 CPD advising data (pdf) (updated 5/28/23) which includes tables of advising main topic for:
- All advisees (students, alumni, and others).
- Undergraduate students by college and total university.
- Graduate students by college and total university.
- Alumni by college and total university.
Undergraduate advising contacts main topic summary:
- 48% seeking experience during college.
- 14% seeking post-graduation employment.
- 12% Health Professions Advising (HPA).
- 14% career-major exploration.
- 5% planning for continuing education other than health professions.
- 8% not known.
Undergraduate advising contacts percentages by college and enrollment:
- Shown in bar graph image and table format below.

| College | 2022-2023 percentage of undergraduate enrollment | 2022-2023 percentage of CPD advising contacts |
|---|---|---|
| University Studies | 1% | 0% |
| Agriculture and Life Sciences | 10% | 13% |
| Architecture, Arts, and Design | 5% | 3% |
| Business | 18% | 17% |
| Engineering | 32% | 25% |
| Liberal Arts and Human Sciences | 14% | 14% |
| Natural Resources and Environment | 3% | 3% |
| Science | 16% | 24% |
| Veterinary Medicine | 1% | 1% |
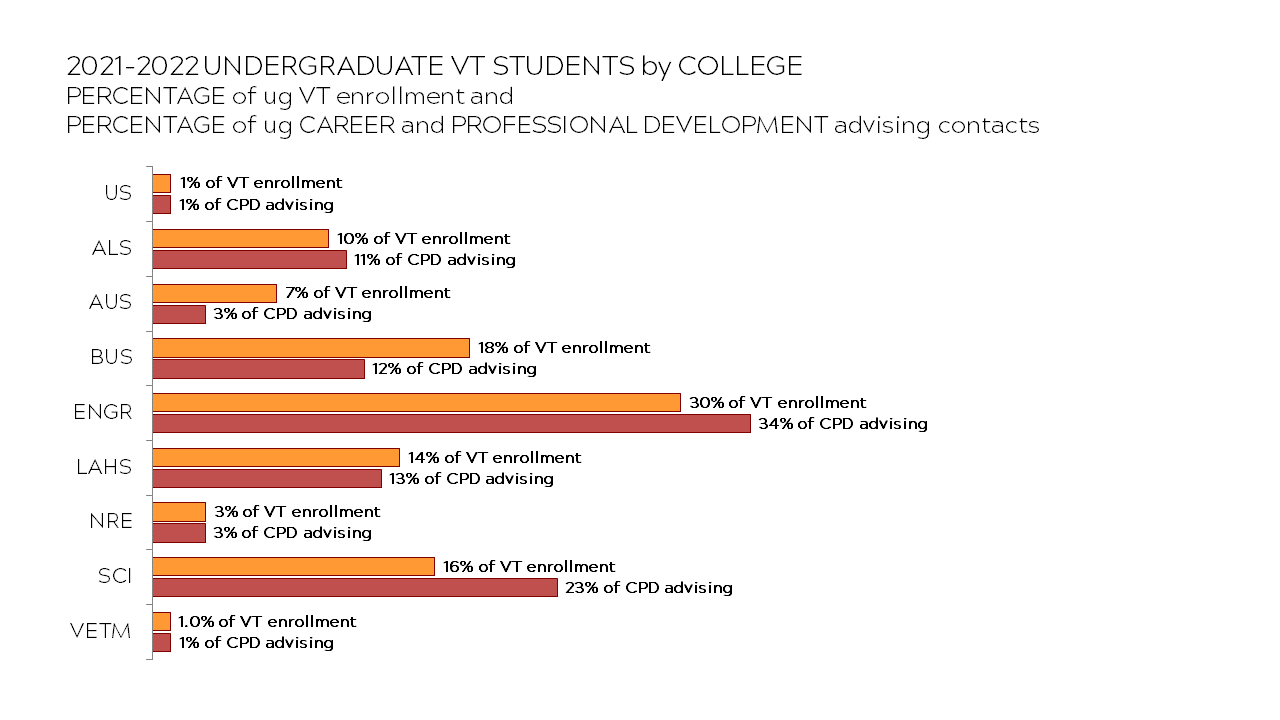
2021-2022 advising data
Notes:
- Data year is May 16, 2021, to May 15, 2022.
- Data tables include enrollment data from university data commons to give context to advising counts.
- All information is subject to correction and updating.
Advising main topics by college and advisee type:
- View 2021-2022 CPD advising data (pdf) (updated 5/26/22) which includes tables of advising main topic for:
- All advisees (students, alumni, and others).
- Undergraduate students by college and total university.
- Graduate students by college and total university.
- Alumni by college and total university.
Undergraduate advising contacts main topic summary:
- 55% seeking experience during college.
- 12% seeking post-graduation employment.
- 11% Health Professions Advising (HPA).
- 7% career-major exploration.
- 5% planning for continuing education other than health professions.
- 10% not known.
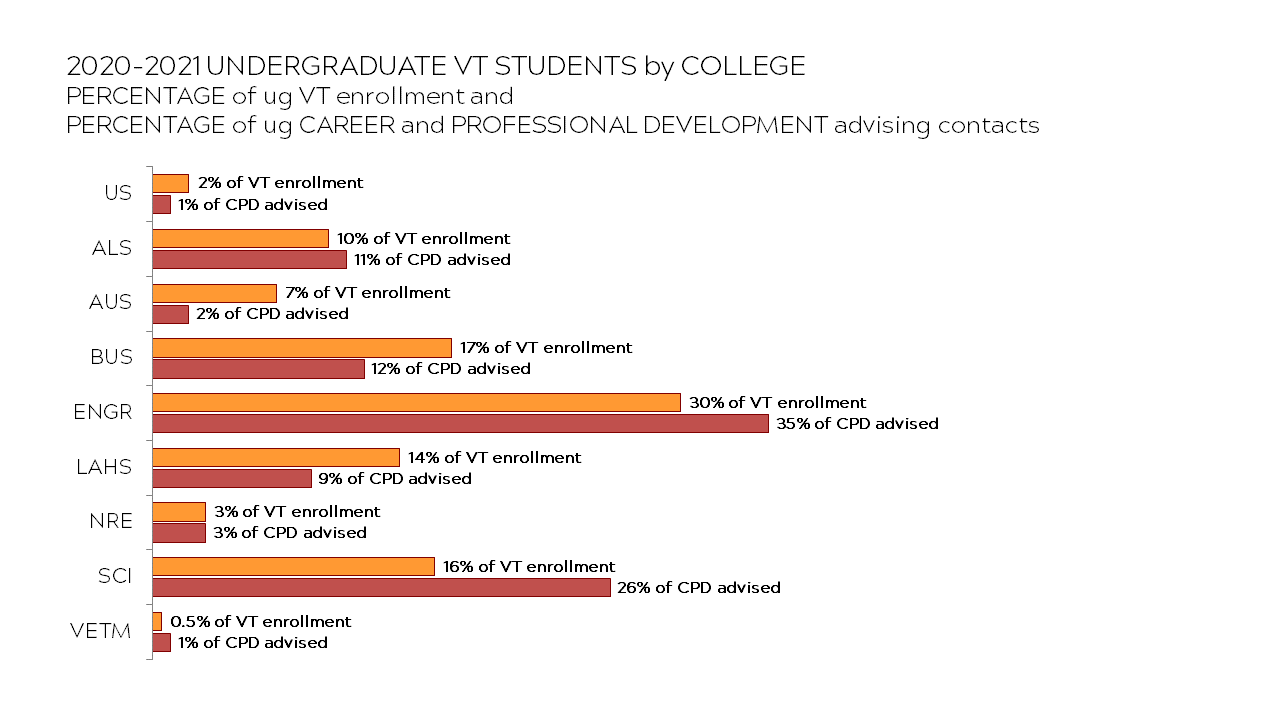
2020-2021 advising data
Notes:
- Data year is May 16, 2020, to May 15, 2021.
- Data tables include enrollment data (from university data commons) to give context to advising counts.
Advising main topics by college and advisee type:
- View 2020-2021 CPD advising of undergraduate students by college and main topic (pdf).
- View 2020-2021 CPD advising of graduate students by college and main topic (pdf).
Main advising topics highlights:
- Undergraduate students:
- 48% seeking experience.
- 22% post-graduation employment.
- Graduate students:
- 69% seeking post-graduation employment.
- 26% seeking experience.
Multi-year:
CPD advising by level and colleges | 2022-2023 and prior:
- View multi-year CPD advising numbers (pdf) by undergrad, graduate and professional, and combined, by colleges
- Includes enrollment numbers from university data commons for context.
CPD advising of undergraduates by main topic | six years, 2022-2023 and prior:
Seeking experience comprises half or more of CPD undergraduate advising contacts.
- View chart multi-year undergraduate advising contact percentages by main topic (pdf).
- Highlights:
- 48-56% seeking experience.
- 7-14% exploring self, careers and majors.
- 12-22% seeking post-graduation employment.
- 11-18% Health Professions Advising (HPA): preparing for admission to professional school for a health career such as medicine, dentistry and other health professions.
- 3-5% planning for continuing education other than health professions.
| Percentage of undergraduate advising contacts by main topic | 2017-2018 | 2018-2019 | 2019-2020 | 2020-2021 | 2021-2022 | 2022-2023 |
|---|---|---|---|---|---|---|
| Career-major exploration | 14% | 10% | 11% | 8% | 7% | 14% |
| Seeking experience during college | 54% | 56% | 52% | 48% | 55% | 48% |
| Post-grad employment | 14% | 18% | 20% | 22% | 12% | 14% |
| Continuing education non-HPA | 4% | 3% | 4% | 4% | 5% | 5% |
| Health Professions Advising HPA | 13% | 13% | 13% | 18% | 11% | 12% |
| No topic recorded | -- | -- | -- | -- | 10% | 8% |
Data in bar chart below also shown in table above.
CPD advising of undergraduates by main topic is detailed in the table below.

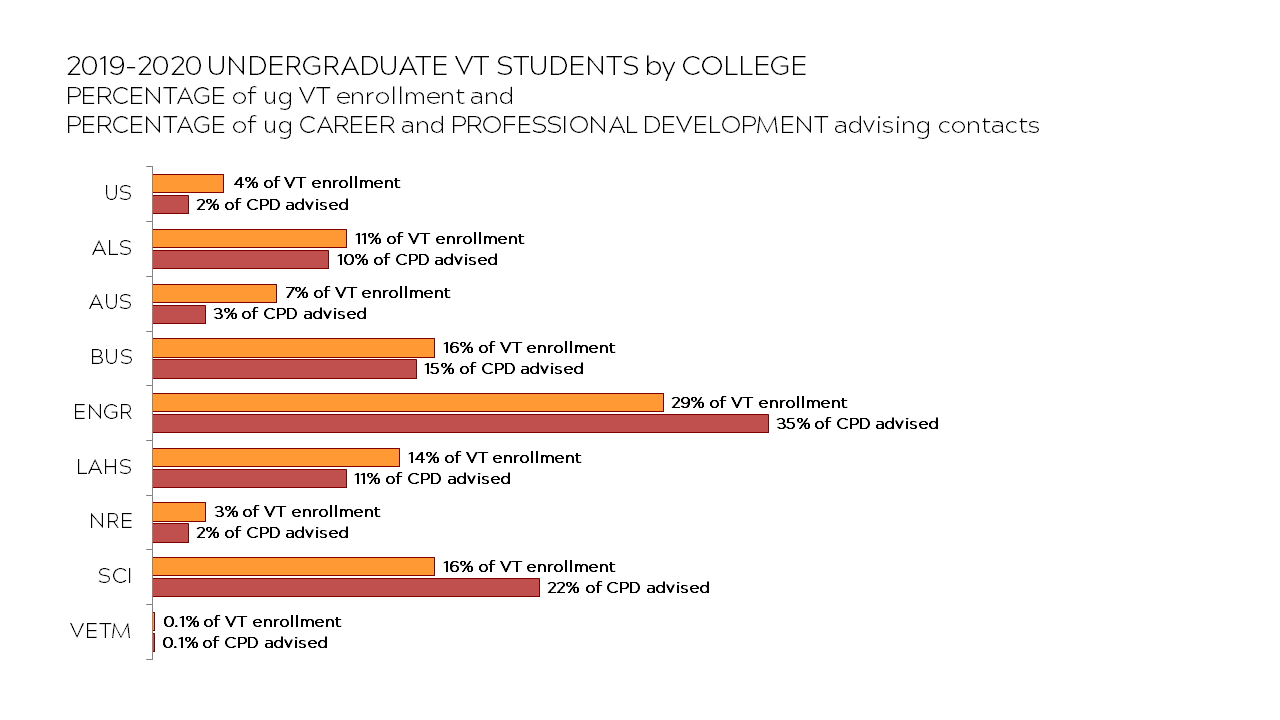
Undergraduate advising and enrollment percentages by college
- Virginia Tech undergraduate enrollment is not distributed equally by college.
- View table for seven years, 2023-2024 and prior, undergraduate enrollment and advising contact percentages by college (pdf).
Data in single-year image charts below viewable in multi-year table format.


Undergraduate and graduate-professional students as percentages of Virginia Tech enrollment and CPD student advising contacts
- View data tables, five years, 2022-2023 and prior, undergraduate and graduate+professional students:
- Graduate students have increased as percentage of Virginia Tech enrollment, from 15% in 2018-2019, to 20% in 2021-2022 and 2022-2023.
- Undergraduate students represent a slightly higher percentage of CPD student advisees as compared to their percentage of Virginia Tech enrollment.
- Note these are percentages of enrolled student advisees, and therefore do not include alumni because they are not enrolled.
- Each year we advise some alumni, and a small number of individuals who are neither students nor alumni.
In 2021-2022, 7% of all advisees were not currently-enrolled students.
In 2022-2023, 11% of advisees were alumni.
| Student percentage of Virginia Tech enrollment and CPD student advisees | 2018-2019 | 2019-2020 | 2020-2021 | 2021-2022 | 2022-2023 |
|---|---|---|---|---|---|
| Undergrad student percentage of Virginia Tech enrollment | 85% | 86% | 81% | 80% | 80% |
| Undergrad student percentage of CPD student advisees | 93% | 91% | 91% | 87% | 88% |
| Grad and professional student percentage of Virginia Tech enrollment | 15% | 14% | 19% | 20% | 20% |
| Grad and professionalstudent percentage of CPD student advisees | 7% | 9% | 9% | 13% | 12% |